
k6 is a free, open-source load testing tool from Grafana Labs. You write the test in JavaScript, run it from the command line, and k6 tells you how fast your API answered and how many requests failed while many virtual users hit it at the same time. In this k6 load testing tutorial we install k6, run a smoke test, add pass/fail rules, and then push a small practice API until it breaks, with the real output explained line by line. You need k6, Node.js (only for the practice API) and basic JavaScript.
Last tested on: k6 v2.3.0 and Node.js 22.22.0 on Linux, October 2026.
In short
- A k6 test is a plain JavaScript file, but k6 itself is a Go program, not Node.js. npm packages do not simply work inside a k6 script.
- Start with a smoke test of one user. Then add thresholds, because thresholds are what turn a page of numbers into a clear pass or fail.
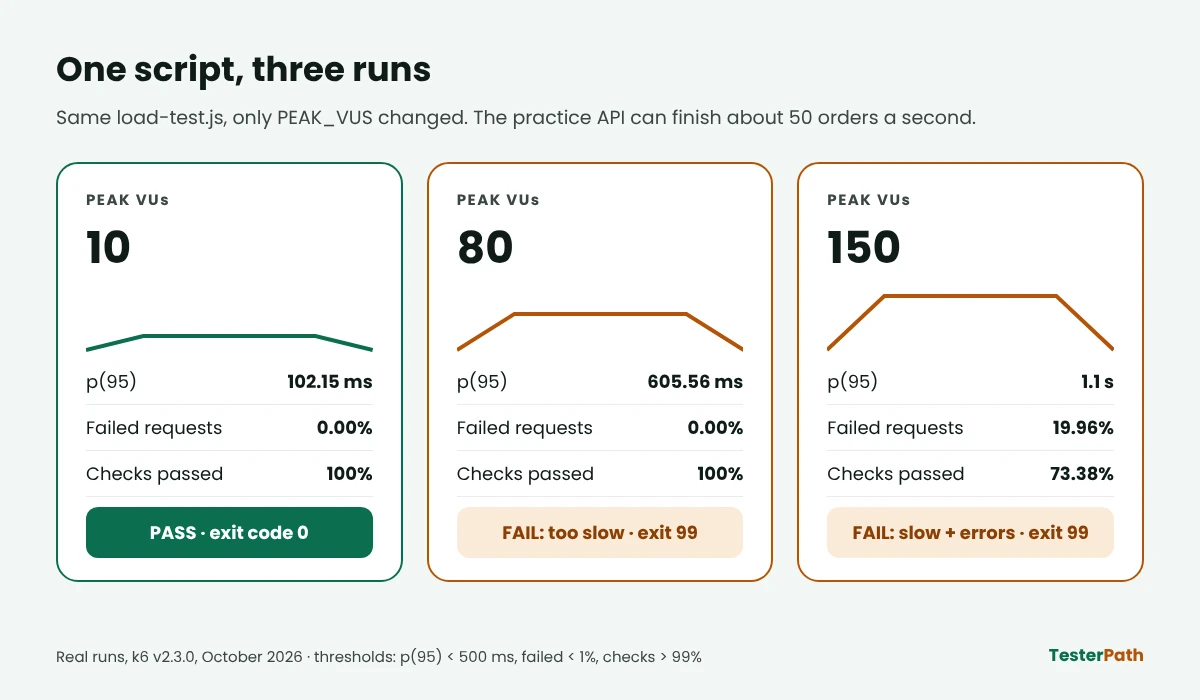
- On our practice API, 10 users passed, 80 users failed the 500 ms rule, and 150 users also produced about 20% errors. Each failed run ended with exit code 99.
- Only load test servers you own or have written permission to test.
What this guide covers
What is k6 load testing?
Think of a food-delivery app at 8 pm on a Friday. The order API works perfectly when you test it alone in Postman. The real question is different: does it still work when hundreds of people press Place Order in the same minute? That is the question load testing answers.
The ISTQB Glossary treats performance testing as the umbrella: testing how efficiently a system performs. Load testing is one kind of it, where you watch how the system behaves as usage moves between low, typical and peak levels. Stress testing goes further and checks behaviour at or beyond the expected limits.
k6 is the tool that creates that traffic. Grafana’s k6 documentation calls it an open-source performance testing tool, and its modules page explains the part that confuses most beginners: the engine is written in Go and runs your script inside an embedded JavaScript engine called Sobek. So you write JavaScript, but you are not inside Node.js or a browser.
k6 vs JMeter: which one should a beginner pick?
This is one of the most searched k6 questions, and the honest answer is that neither is better for everyone. They suit different teams.
| Point | k6 | Apache JMeter |
|---|---|---|
| Built with | Go, with an embedded JavaScript engine | Java |
| How you create a test | Write a JavaScript or TypeScript file | Build a test plan in a GUI, then run it from the GUI or command line |
| Where tests live | Plain files, easy to keep in Git and review like code | Test plan files created and edited mainly through the GUI |
| Protocols | HTTP, WebSockets and gRPC modules built in, a browser module, more through extensions | HTTP/HTTPS, SOAP/REST, FTP, JDBC, LDAP, JMS, mail, TCP and more |
| Licence | AGPL-3.0, free to use | Apache Software Foundation project, free to use |
| Good fit when | Your team already writes code and wants tests in the CI pipeline | Your team prefers building tests visually, or needs a protocol JMeter already handles |
Our opinion: if you are a manual or API tester moving towards automation, k6 is the easier start, because a k6 script looks like the JavaScript you would write for API checks anyway. The trade-off is real though. k6 itself is a command-line tool with no screen for building tests. Grafana offers a separate desktop app, k6 Studio, that records a browser flow and turns it into a script, but you still end up maintaining JavaScript, and a team that does not want to touch code will feel that.
Step 1: Install k6
Pick the command for your system from the official install page. These are the ones it lists:
| System | Command |
|---|---|
| Windows (winget) | winget install k6 --source winget |
| Windows (Chocolatey, unofficial package) | choco install k6 |
| macOS (Homebrew) | brew install k6 |
| Docker | docker pull grafana/k6 |
| Debian / Ubuntu | Four apt commands to add the k6 repository; copy them from the install page |
Then check the version. This is what our machine printed:
k6 versionk6 v2.3.0 (commit/e088784614, go1.26.8, linux/amd64)Your commit and platform text will differ. The part that matters is the version number, so you know which documentation applies to you.
Step 2: Start a practice API you are allowed to hit
Here is a rule worth learning on day one: a load test against a server you do not own looks exactly like an attack from the other side. Free public APIs that beginners use for functional practice are shared by thousands of people, so do not point load at them. Grafana runs its own demo app, QuickPizza, which its docs use in examples, but the safest choice is a server on your own laptop.
So we wrote a tiny food-order API for this guide. It needs only Node.js, no npm install. Save this as practice-api.js (JavaScript, Node.js):
// practice-api.js - a tiny food-order API for load testing practice.
// No npm packages needed. Run it with: node practice-api.js
const http = require('http');

const MENU = [
  { id: 1, dish: 'Masala Dosa', price: 90 },
  { id: 2, dish: 'Paneer Thali', price: 180 },
  { id: 3, dish: 'Veg Biryani', price: 150 },
];

const KITCHEN_SLOTS = 5;   // orders cooked at the same time
const COOK_TIME_MS = 100;  // time one order takes
const MAX_WAITING = 50;    // more than this and the kitchen says "full"

let busy = 0;
let nextOrderId = 1000;
const waiting = [];

function send(res, status, body) {
  res.writeHead(status, { 'Content-Type': 'application/json' });
  res.end(JSON.stringify(body));
}

function cook(job) {
  busy++;
  setTimeout(() => {
    busy--;
    job();
    if (waiting.length > 0) cook(waiting.shift());
  }, COOK_TIME_MS);
}

const server = http.createServer((req, res) => {
  if (req.method === 'GET' && req.url === '/menu') {
    return send(res, 200, MENU);
  }

  if (req.method === 'POST' && req.url === '/orders') {
    let raw = '';
    req.on('data', (chunk) => (raw += chunk));
    req.on('end', () => {
      let order;
      try {
        order = JSON.parse(raw);
      } catch (err) {
        return send(res, 400, { error: 'Body must be JSON' });
      }
      if (!MENU.some((item) => item.id === order.dishId)) {
        return send(res, 400, { error: 'Unknown dishId' });
      }
      if (waiting.length >= MAX_WAITING) {
        return send(res, 503, { error: 'Kitchen is full, try again' });
      }
      const job = () =>
        send(res, 201, { orderId: nextOrderId++, dishId: order.dishId, status: 'PLACED' });
      if (busy < KITCHEN_SLOTS) cook(job);
      else waiting.push(job);
    });
    return;
  }

  send(res, 404, { error: 'Not found' });
});

server.listen(3000, () => {
  console.log('Practice API running on http://localhost:3000');
});
Three numbers at the top decide how this API behaves under load. The kitchen cooks 5 orders at a time and each order takes 100 ms, so it can finish about 50 orders a second. If more than 50 orders are already waiting, new ones get a 503 with “Kitchen is full”. Because we know the capacity in advance, we can check whether k6 finds it.
Start it in one terminal and leave it running:
node practice-api.jsPractice API running on http://localhost:3000Open http://localhost:3000/menu in your browser. You should see three dishes as JSON.
Step 3: Your first k6 script, a smoke test
Every round of k6 load testing should start here. A smoke test uses a tiny load to prove two things: the script works, and the system responds correctly before you add pressure. Save this as smoke-test.js (JavaScript, k6):
// smoke-test.js - one virtual user, just to prove the script and the API work.
import http from 'k6/http';
import { check, sleep } from 'k6';

export const options = {
  vus: 1,
  duration: '10s',
};

export default function () {
  const res = http.get('http://localhost:3000/menu');

  check(res, {
    'menu returns 200': (r) => r.status === 200,
    'menu has 3 dishes': (r) => r.json().length === 3,
  });

  sleep(1);
}
A few lines do most of the work. import http from 'k6/http' pulls in k6’s own HTTP client. The options object asks for 1 virtual user (VU) for 10 seconds. The default function is what each VU repeats in a loop until time runs out. check() records whether a condition was true, and sleep(1) pauses for a second, the way a real person pauses between taps.
Everything outside default is init code. The test lifecycle page says it runs once per VU and cannot make HTTP requests, so keep your requests inside the function.
Open a second terminal in the same folder and run:
k6 run smoke-test.jsBelow is the summary part of our real output. The progress lines printed while the test runs are left out.
  █ TOTAL RESULTS

    checks_total.......: 20      1.994897/s
    checks_succeeded...: 100.00% 20 out of 20
    checks_failed......: 0.00%   0 out of 20

    ✓ menu returns 200
    ✓ menu has 3 dishes

    HTTP
    http_req_duration..............: avg=1.34ms min=667.67µs med=933.26µs max=4.76ms p(90)=1.68ms p(95)=3.22ms
      { expected_response:true }...: avg=1.34ms min=667.67µs med=933.26µs max=4.76ms p(90)=1.68ms p(95)=3.22ms
    http_req_failed................: 0.00%  0 out of 10
    http_reqs......................: 10     0.997449/s

    EXECUTION
    iteration_duration.............: avg=1s     min=1s       med=1s       max=1s     p(90)=1s     p(95)=1s
    iterations.....................: 10     0.997449/s
    vus............................: 1      min=1       max=1
    vus_max........................: 1      min=1       max=1

    NETWORK
    data_received..................: 3.0 kB 300 B/s
    data_sent......................: 740 B  74 B/s
Read it from the top. Two checks ran on each of 10 iterations, so checks_total is 20, and all 20 passed. http_reqs is 10 because one VU made one request per second for 10 seconds. http_req_failed is 0.00%, and the slowest request took under 5 ms. The script and the API are fine, so it is safe to add load.
Step 4: A k6 load test with stages and thresholds
Now we move from one user to many. Save this as load-test.js (JavaScript, k6):
// load-test.js - ramp up, hold, ramp down, with pass/fail rules.
import http from 'k6/http';
import { check, sleep } from 'k6';

const BASE_URL = 'http://localhost:3000';
const PEAK_VUS = Number(__ENV.PEAK_VUS || 10);

export const options = {
  stages: [
    { duration: '10s', target: PEAK_VUS }, // ramp up
    { duration: '30s', target: PEAK_VUS }, // hold the load
    { duration: '10s', target: 0 },        // ramp down
  ],
  thresholds: {
    http_req_failed: ['rate<0.01'],   // less than 1% of requests may fail
    http_req_duration: ['p(95)<500'], // 95% of requests must finish under 500 ms
    checks: ['rate>0.99'],            // more than 99% of checks must pass
  },
};

export default function () {
  const menu = http.get(`${BASE_URL}/menu`);
  check(menu, { 'menu returns 200': (r) => r.status === 200 });

  const payload = JSON.stringify({ dishId: 2, qty: 1 });
  const params = { headers: { 'Content-Type': 'application/json' } };
  const order = http.post(`${BASE_URL}/orders`, payload, params);

  check(order, {
    'order returns 201': (r) => r.status === 201,
    'order has an orderId': (r) => r.status === 201 && r.json().orderId > 0,
  });

  sleep(1); // think time: a real user does not order every millisecond
}
stages shapes the load: climb to the peak in 10 seconds, hold it for 30, then come down in 10. PEAK_VUS comes from an environment variable, so the same script can run at 10, 80 or 150 users without editing it. The options reference notes that -e only sets script variables; it does not change k6 options by itself, which is why the script reads it into stages.
The thresholds block is the most useful part. Each line is a rule in the form metric, aggregation, limit. Here we say less than 1% of requests may fail, 95% must finish under 500 ms, and more than 99% of checks must pass. The thresholds page explains that if any rule is broken, k6 marks the whole run as failed.
Run it with the default 10 users:
k6 run load-test.js █ THRESHOLDS
checks
✓ 'rate>0.99' rate=100.00%
http_req_duration
✓ 'p(95)<500' p(95)=102.15ms
http_req_failed
✓ 'rate<0.01' rate=0.00%
█ TOTAL RESULTS
checks_total.......: 1113 21.931327/s
checks_succeeded...: 100.00% 1113 out of 1113
checks_failed......: 0.00% 0 out of 1113
✓ menu returns 200
✓ order returns 201
✓ order has an orderId
HTTP
http_req_duration..............: avg=51.35ms min=240.83µs med=53.04ms max=162.06ms p(90)=101.57ms p(95)=102.15ms
{ expected_response:true }...: avg=51.35ms min=240.83µs med=53.04ms max=162.06ms p(90)=101.57ms p(95)=102.15ms
http_req_failed................: 0.00% 0 out of 742
http_reqs......................: 742 14.620885/s
EXECUTION
iteration_duration.............: avg=1.1s min=1.1s med=1.1s max=1.16s p(90)=1.1s p(95)=1.1s
iterations.....................: 371 7.310442/s
vus............................: 1 min=1 max=10
vus_max........................: 10 min=10 max=10
NETWORK
data_received..................: 195 kB 3.8 kB/s
data_sent......................: 83 kB 1.6 kB/sAll three thresholds show a tick, and k6 exited with code 0. Notice something odd, though: the average request time is 51.35 ms, yet p(95) is 102.15 ms. That is because half the requests are the menu call (around 1 ms) and half are orders (around 100 ms, the cooking time). The average mixes them into a number that describes neither. Keep that in mind; it comes back in the mistakes section.
How to read the k6 summary
| Line in the output | What it means in plain words | What we look at first |
|---|---|---|
| http_req_duration | Time for a request, counted as sending + waiting + receiving. DNS lookup and connection setup are not included | p(95), not avg |
| { expected_response:true } | The same timing, but only for responses with status 200 to 399 | Compare with the line above when there are errors |
| http_req_failed | Share of requests k6 counted as failed | Anything above 0% needs a reason |
| http_reqs | Total requests and requests per second | Whether you reached the traffic you planned |
| checks_succeeded | Share of your check() conditions that were true | Which named check failed |
| iterations | How many times VUs finished the default function | Matches the user journeys you expected |
| iteration_duration | Time for one full loop, including sleep | Jumps here mean users waited longer |
| vus / vus_max | Active virtual users, current and maximum | That the ramp reached the peak |
| data_received / data_sent | Network traffic during the test | Rarely first; useful for large responses |
By default the summary shows avg, min, med, max, p(90) and p(95) for timing metrics, according to the options reference. If you follow an older tutorial, your output will look different: the end-of-test summary page notes that k6 v2.0.0 removed the legacy summary mode and the --no-summary flag.
Step 5: Push the API until it breaks
This is the part most beginner tutorials skip. We ran the same script twice more, at 80 and then at 150 users:
k6 run -e PEAK_VUS=80 load-test.js
k6 run -e PEAK_VUS=150 load-test.js| Peak VUs | p(95) duration | Failed requests | Checks passed | Thresholds | Exit code |
|---|---|---|---|---|---|
| 10 | 102.15 ms | 0.00% (0 of 742) | 100% | All passed | 0 |
| 80 | 605.56 ms | 0.00% (0 of 4,364) | 100% | p(95) failed | 99 |
| 150 | 1.1 s | 19.96% (1,555 of 7,790) | 73.38% | All three failed | 99 |
Look at the 80-user row first. Not a single error, every check passed, and the run still failed. Orders were queuing in the kitchen, so 95% of requests took up to about 600 ms instead of 100 ms. A user would see the spinner for longer and might press the button again. A run with zero errors can still be a failed run, and that is exactly why the duration threshold exists.
At 150 users the queue filled up and the API started returning 503. This is the threshold and check part of that output:
  █ THRESHOLDS

    checks
    ✗ 'rate>0.99' rate=73.38%

    http_req_duration
    ✗ 'p(95)<500' p(95)=1.1s

    http_req_failed
    ✗ 'rate<0.01' rate=19.96%


  █ TOTAL RESULTS

    checks_total.......: 11685  230.189651/s
    checks_succeeded...: 73.38% 8575 out of 11685
    checks_failed......: 26.61% 3110 out of 11685

    ✓ menu returns 200
    ✗ order returns 201
      ↳  60% — ✓ 2340 / ✗ 1555
    ✗ order has an orderId
      ↳  60% — ✓ 2340 / ✗ 1555
http_req_failed................: 19.96% 1555 out of 7790
time="2026-10-08T08:20:20+05:30" level=error msg="thresholds on metrics 'checks, http_req_duration, http_req_failed' have been crossed"The check lines tell you where it broke: the menu call stayed at 100%, while 1,555 order calls did not get a 201. The 1,555 failed checks match the 1,555 failed requests, which points straight at the order endpoint.
The numbers also match the design. At 150 users the summary shows about 77 iterations a second, each placing one order, while the kitchen can finish only about 50. k6 found the limit we built in, which is the best proof that you are reading the output correctly.
Exit code 99 and why CI pipelines care
Right after the 150-user run we printed the exit code (bash):
echo $?99In the k6 source code, exit code 99 is named ThresholdsHaveFailed. A CI tool such as GitHub Actions or Jenkins treats any non-zero exit as a failed step, so a performance rule can block a release without anybody reading the report. In PowerShell, the same value is in $LASTEXITCODE (we did not run this one, as our machine was Linux).
Get a shareable HTML report
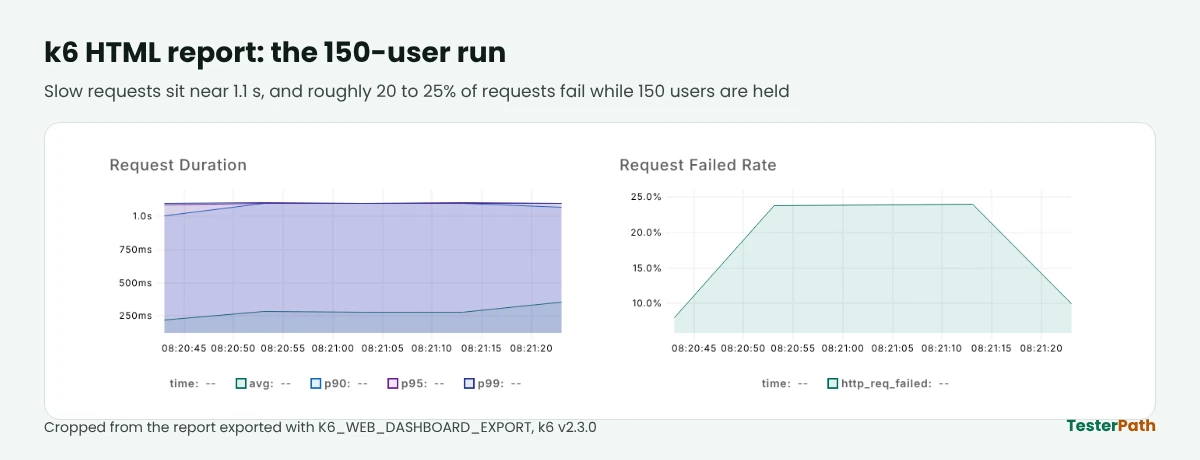
k6 has a built-in web dashboard. Following the web dashboard page, this command (bash) runs the test and saves a self-contained HTML report when it ends:
K6_WEB_DASHBOARD=true K6_WEB_DASHBOARD_EXPORT=k6-report.html k6 run -e PEAK_VUS=150 load-test.jsOn Windows PowerShell, set the two variables first, then run the test. We did not run this variant ourselves:
$env:K6_WEB_DASHBOARD="true"
$env:K6_WEB_DASHBOARD_EXPORT="k6-report.html"
k6 run -e PEAK_VUS=150 load-test.js
While the test runs, the live dashboard is at http://127.0.0.1:5665. The docs mention one limitation: graphs only appear if the test runs longer than three refresh periods, which is 30 seconds by default.
Which type of load test should you run?
The 150-user run above was a small stress test. Grafana’s load test types guide describes six types, and the summary below is in our own words:
| Type | Load | Typical length | Question it answers |
|---|---|---|---|
| Smoke | Very low | Seconds to minutes | Does the script work, and does the system respond at all? |
| Average-load | Normal production level | About 5 to 60 minutes | Is it fine on a normal day? |
| Stress | Above normal | About 5 to 60 minutes | What happens on a heavy day, like a sale? |
| Soak | Normal | Hours | Does it slowly get worse over a long period? |
| Spike | Very high, sudden | A few minutes | Can it survive a sudden rush, like tatkal booking opening? |
| Breakpoint | Keeps rising | As long as needed | Where exactly is the limit? |
Our runs were 50 seconds long so you can repeat them quickly. That is fine for learning, but it is far shorter than the 5 to 60 minutes the guide describes for real average-load and stress tests. The guide also recommends starting with a smoke test and keeping load shapes simple: ramp up, hold, ramp down.
Common mistakes beginners make in k6 load testing
Load testing someone else’s server. Practice APIs and staging servers of other companies are not yours to stress. Use a local API like ours, or get written permission for your project’s environment.
Trusting the average. Our 10-user run showed an average of 51 ms while every order took about 100 ms. Look at p(95), and when one script calls several endpoints, give each a name tag and set thresholds per tag, which the thresholds page shows how to do.
Treating checks as assertions. A failed check() does not stop or fail the test. The checks page says so directly. If a check matters, add a threshold on checks, as our script does.
Forgetting think time. Without sleep(), each VU fires requests as fast as the server answers, which is a very different load from real users. Sometimes that is what you want, but decide it on purpose.
Using npm packages or Node.js APIs. require('fs') or an axios import will not work in a k6 script. The modules page says k6 is not Node.js and suggests a bundler if you need outside code.
Running k6 and the app on one small laptop. Both fight for the same CPU, so the numbers partly measure your laptop. Our own runs have this limitation, which is fine for learning but not for a real report.
What the official docs say
Grafana’s Running k6 page covers k6 new, which creates a starter script.js, and adding --vus and --duration from the command line. The built-in metrics reference defines every line in the summary, including that http_req_duration is sending plus waiting plus receiving. The HTTP requests page says responses with status 200 to 399 count as expected by default, which is why our 503s showed up as failed requests.
The checks page confirms that failed checks do not change the exit status on their own, and the thresholds page gives the expression format we used. For the tool itself, the v2.3.0 release notes on GitHub list what changed in the version we tested, and the repository’s licence file is the GNU AGPL v3.
k6 load testing interview questions
What is a virtual user in k6?
A VU is an independent loop that runs your default function again and again, like one simulated person. Ten VUs means ten of these loops running at the same time, each with its own state.
What is the difference between checks and thresholds?
A check records whether one response met a condition and the test keeps going. A threshold is a rule on a whole metric across the run, such as p(95) under 500 ms, and it decides pass or fail.
Why use p(95) instead of the average response time?
The average hides slow requests and mixes fast and slow endpoints. p(95) tells you that 95% of requests were at or under that time, which is closer to what most users actually felt.
How would you make a CI pipeline fail when the API gets slow?
Add thresholds to the script. When one is crossed, k6 exits with code 99, and the CI step fails automatically. You can also stop the test early with abortOnFail.
What is the difference between load testing and stress testing?
Load testing checks behaviour across low, typical and peak usage. Stress testing pushes at or beyond the expected limit to see how and where the system breaks.
FAQ
What is k6 load testing?
k6 load testing means using the open-source tool k6 to send traffic from many virtual users to an API or website and measure response times, errors and throughput. You write the test in JavaScript, run it from the command line, and set thresholds that decide whether the run passes or fails.
Is k6 a free tool?
Yes. The k6 tool is open source under the GNU AGPL v3 licence, and you can install and run it locally at no cost. Grafana Labs also offers a hosted cloud service around k6, which is a separate product. Everything in this tutorial uses only the free command-line tool.
Is k6 better than JMeter?
Neither is better for every team. k6 suits testers who are comfortable writing JavaScript and want tests stored in Git and run in CI. JMeter suits teams that prefer a GUI for building test plans or need one of its many built-in protocols. Try both on a small API before choosing.
Do I need to know JavaScript to use k6?
Basic JavaScript is enough to start: variables, functions, objects and arrow functions. The scripts in this guide use nothing more. You do not need Node.js knowledge for k6 itself, and npm packages are not supported directly, because k6 runs scripts in its own JavaScript engine.
Can k6 test APIs as well as websites?
Yes. Most k6 tests send HTTP requests to APIs, as in this guide. k6 also includes modules for WebSockets and gRPC, and a browser module that drives a real browser for page-level performance tests. For beginners, API load tests are the simplest place to start.
What to practise next
Run the three tests yourself and compare your numbers with ours. They will not match exactly, and working out why is good practice, because real k6 load testing is mostly about reading results like these. Then change the script so the menu and order calls each get their own name tag and threshold, and run an average-load test for 10 minutes instead of 50 seconds.
If your API checks are still manual, start with our Playwright vs Postman comparison for API checks, because a load test only makes sense once the API works for one user. For where performance testing fits in a tester’s growth, see our manual testing career guide, and browse the Test Automation section for more scripted testing guides.
Sources
- Grafana Labs – Grafana k6 documentation (latest, 2026)
- Grafana Labs – Install k6 (2026)
- Grafana Labs – Running k6 (2026)
- Grafana Labs – Test lifecycle (2026)
- Grafana Labs – Checks (2026)
- Grafana Labs – Thresholds (2026)
- Grafana Labs – Built-in metrics reference (2026)
- Grafana Labs – HTTP requests (2026)
- Grafana Labs – Modules (2026)
- Grafana Labs – Options reference (2026)
- Grafana Labs – End-of-test summary (2026)
- Grafana Labs – Web dashboard (2026)
- Grafana Labs – Load test types (2026)
- Grafana Labs – Grafana k6 Studio (2026)
- grafana/k6 on GitHub – Release v2.3.0, exit codes source file and licence (v2.3.0)
- ISTQB Glossary – performance testing, load testing and stress testing (V4.8.1)
- The Apache Software Foundation – Apache JMeter (2026)
Tools and features change often. Check the official documentation for the version you are using.